Mapping Supply Chains with No-Code Knowledge Graphs
by KgBase
January 10, 2022
Introducing Supply Chain Knowledge Graph for Climate Action
While ESG disclosures are still voluntary and unstandardized, companies will soon be obliged to tell investors about their “carbon footprint”.
Supply chains are the crux of the issue…
90% of companies’ carbon footprint is located in the supply chain, often generated by third-party vendors.
As of 2021, there has been more than $130 trillion in public and private investment pledged to help curb climate change, but investors and climate action stakeholders need supply chain data to make better-informed decisions.
Nike, for example, aims to use 100% renewable energy by 2025 but its pledge applies only to its own offices, stores and factories… while 80% of the brand’s carbon footprint comes from the *sourcing* of its materials and manufacturing.
Over 100,000,000,000 metric tons of emissions (equal to emissions of Brazil and Mexico combined) could be saved if suppliers to just 125 multinationals increased their renewable energy by 20%. (According to CDP.)

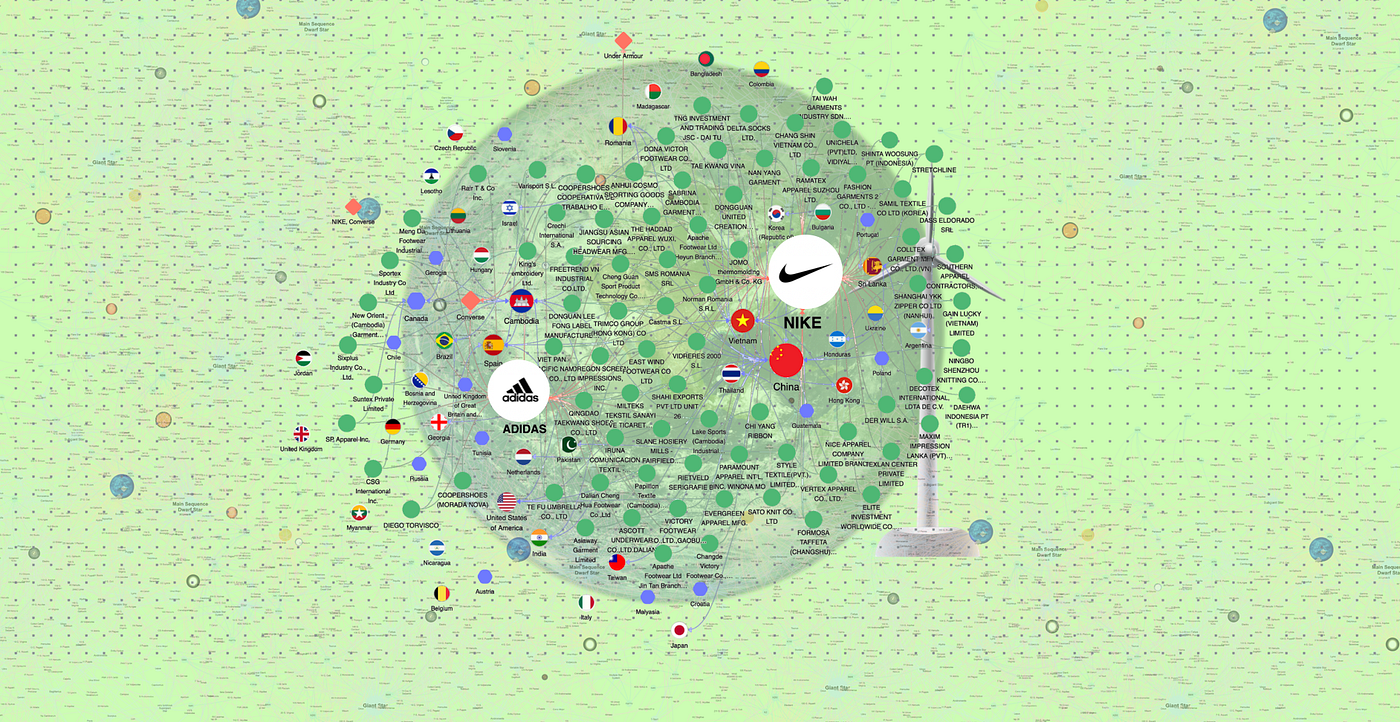
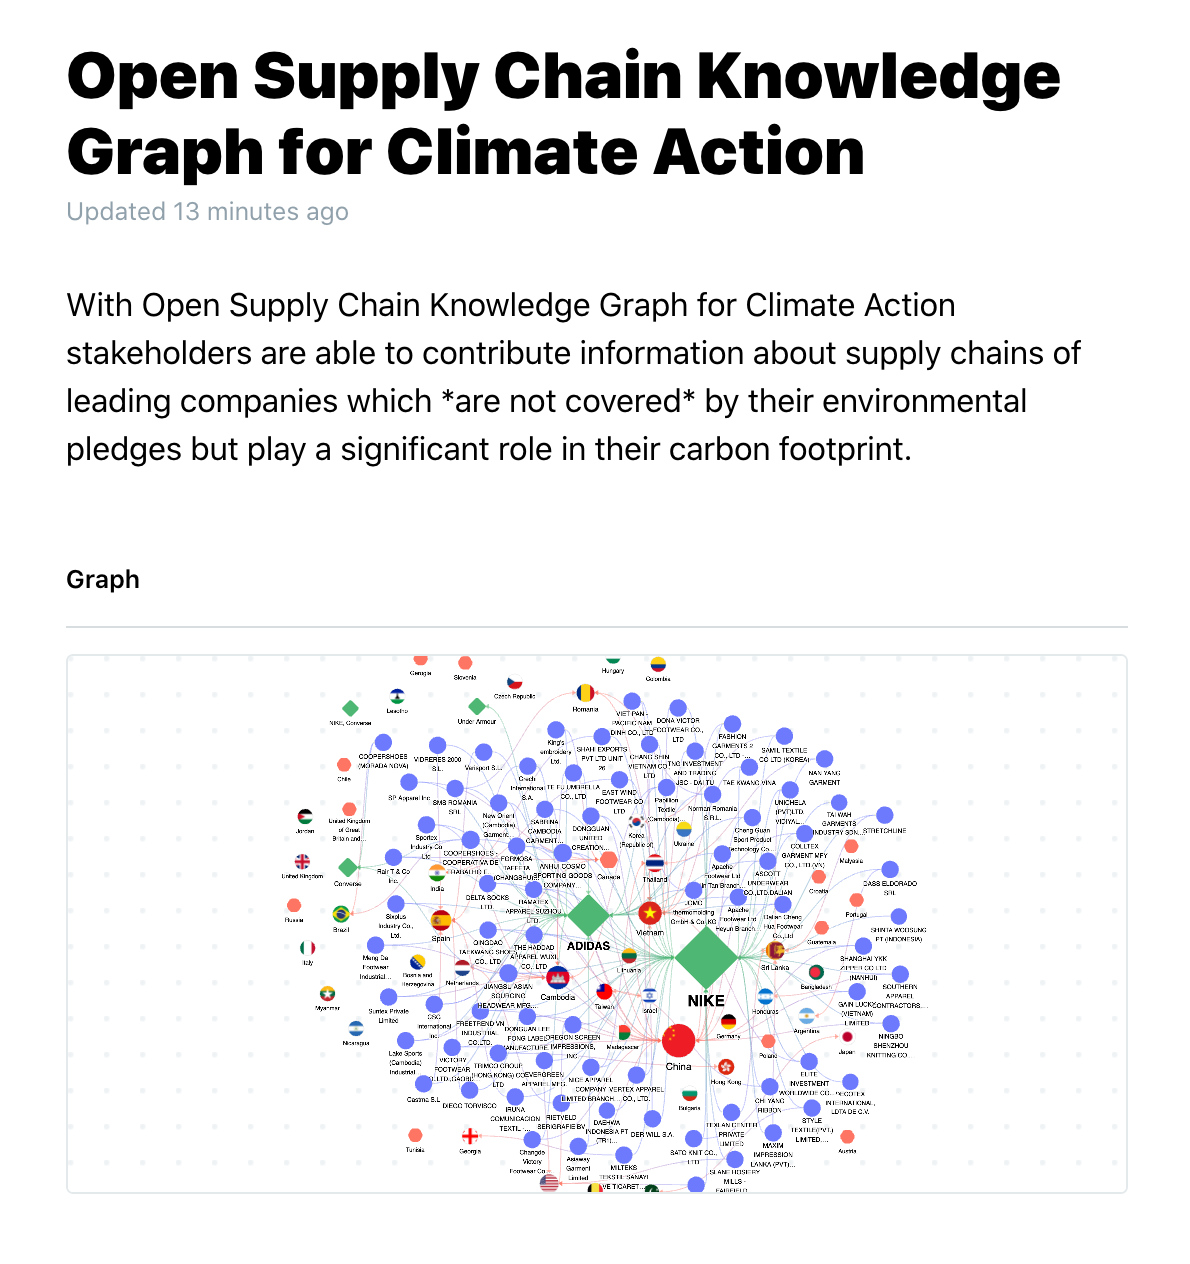
With the Supply Chain Knowledge Graph for Climate Action stakeholders can now contribute information about supply chains of leading companies that are not covered by their environmental pledges but play a significant role in their carbon footprint.
This data is a missing link in analyzing the environmental risks related to companies and countries participating in the manufacturing processes.
Supply Chain Knowledge Graph for Climate Action is an open dataset with a mission to improve country and company-level collaboration on renewable energy adoption and local manufacturing sustainability reporting.
According to CDP, suppliers’ climate change risks could cost investors and companies over US$906 billion in the next 5 years.
Building a No-Code Supply Chain Knowledge Graphs
Many companies are already releasing annual sustainability reports, but due to a lack of standardized reporting, analyzing their impact on the environment continues to be a challenge.
With no-code knowledge graph tools like Kgbase, climate action stakeholders can now collaborate on supply chain data.
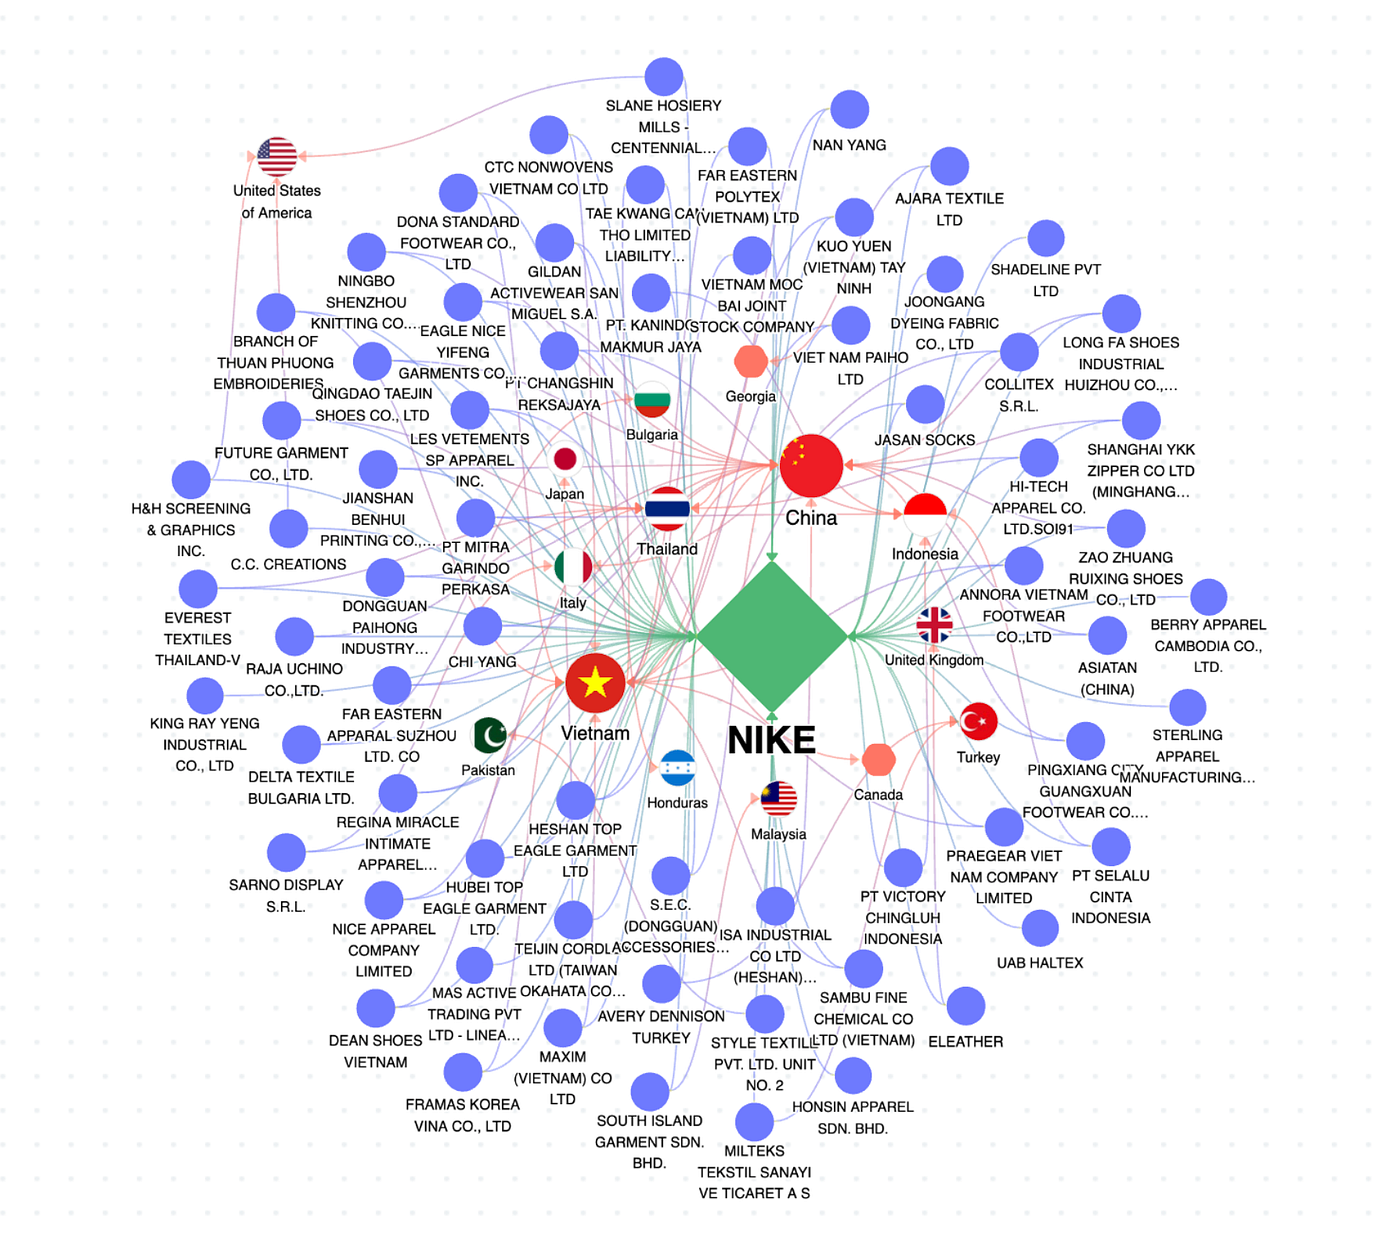
Remember Nike? In 2021, Nike and Adidas released their Annual Factory Lists in a machine readable format for the first time.
Thanks to Kgbase’s unique set of tools (collaboration, knowledge graph visualization, data aggregation, mapping and analysis), I was able to unify the company’s data and develop a Supply Chain Knowledge Graph for Climate Action.
Here is how I created this data initiative with Kgbase — and how you can create a project about any topic you care about.
Create A Unified Template
Even though the Adidas and Nike factory lists include very similar data inputs, their reporting format varies and requires significant cleanup and organization prior to analysis and mapping.

Both companies have released carbon neutrality pledges to the public, but their supply chain reporting does not contain GHG emissions data or renewable energy targets for external vendors, or gender data on their vendors’ leadership.
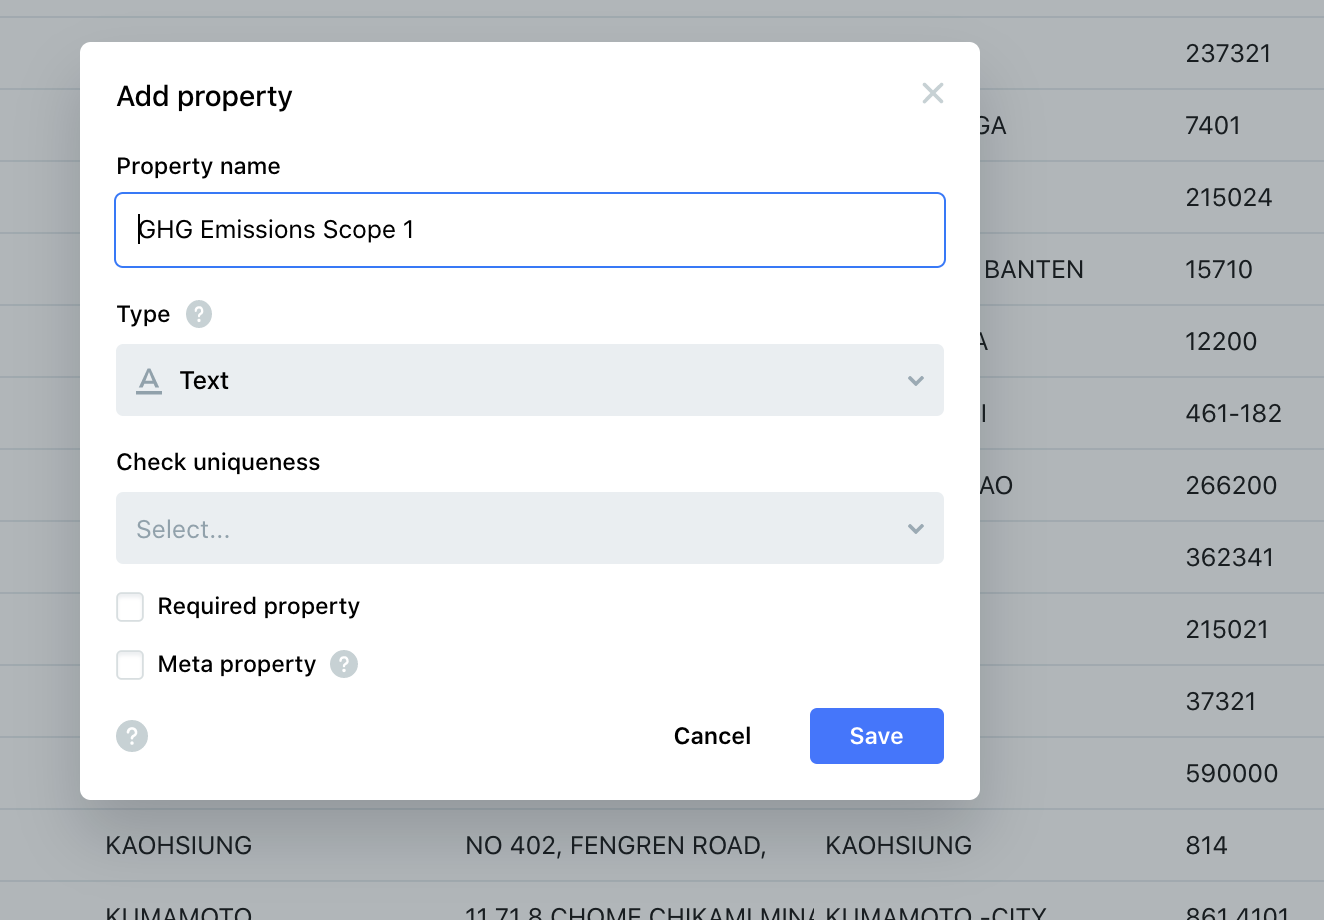
With Kgbase, you can create public and private templates for such reports and define the data inputs for collaboration, review and approval.
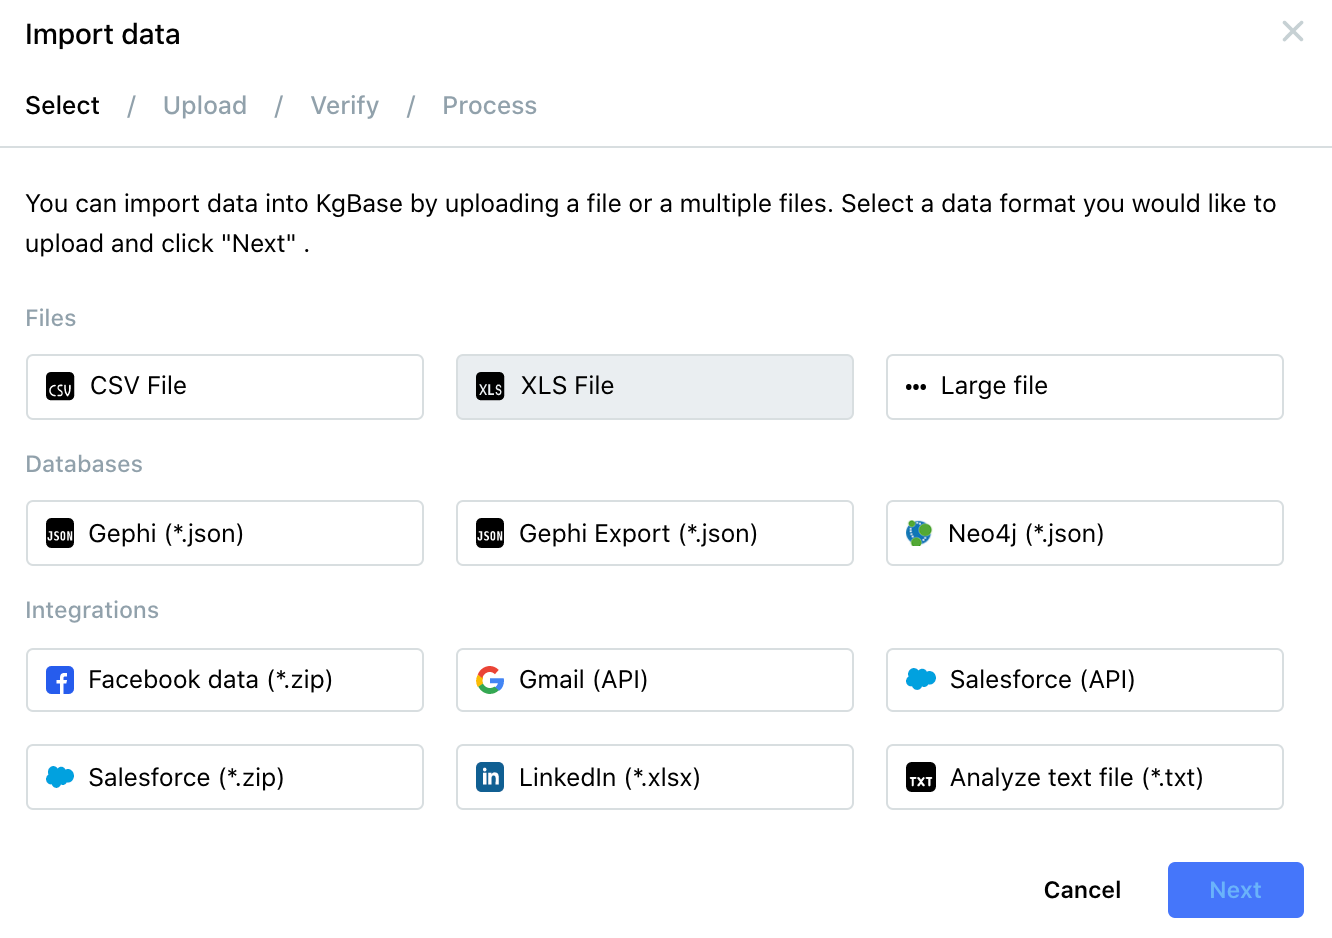
Import & Map Relevant Data
Once you have your template ready, it’s time to import the data into the project.
Kgbase offers numerous integrations, file format options and databases to simplify this process for you and other contributors.
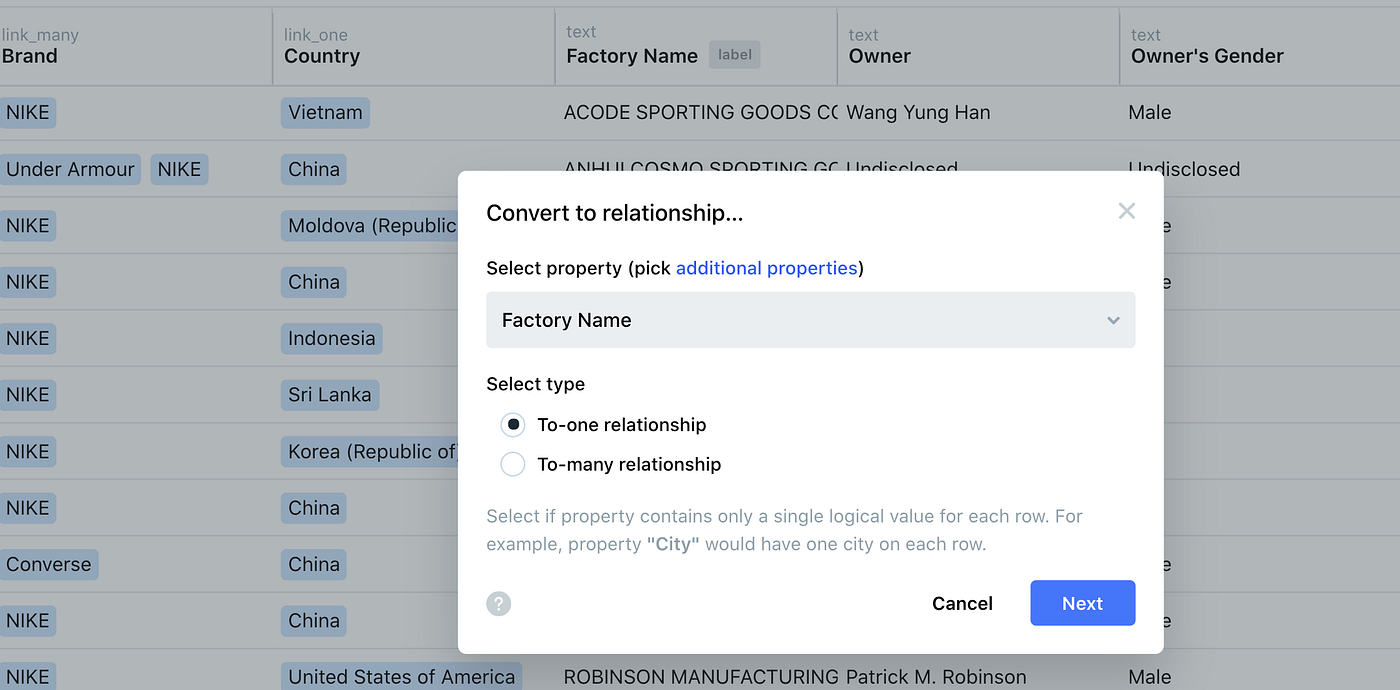
Create Relationships Between Entities
The unique properties of a knowledge graph enable an analysis of the relationships between entities.
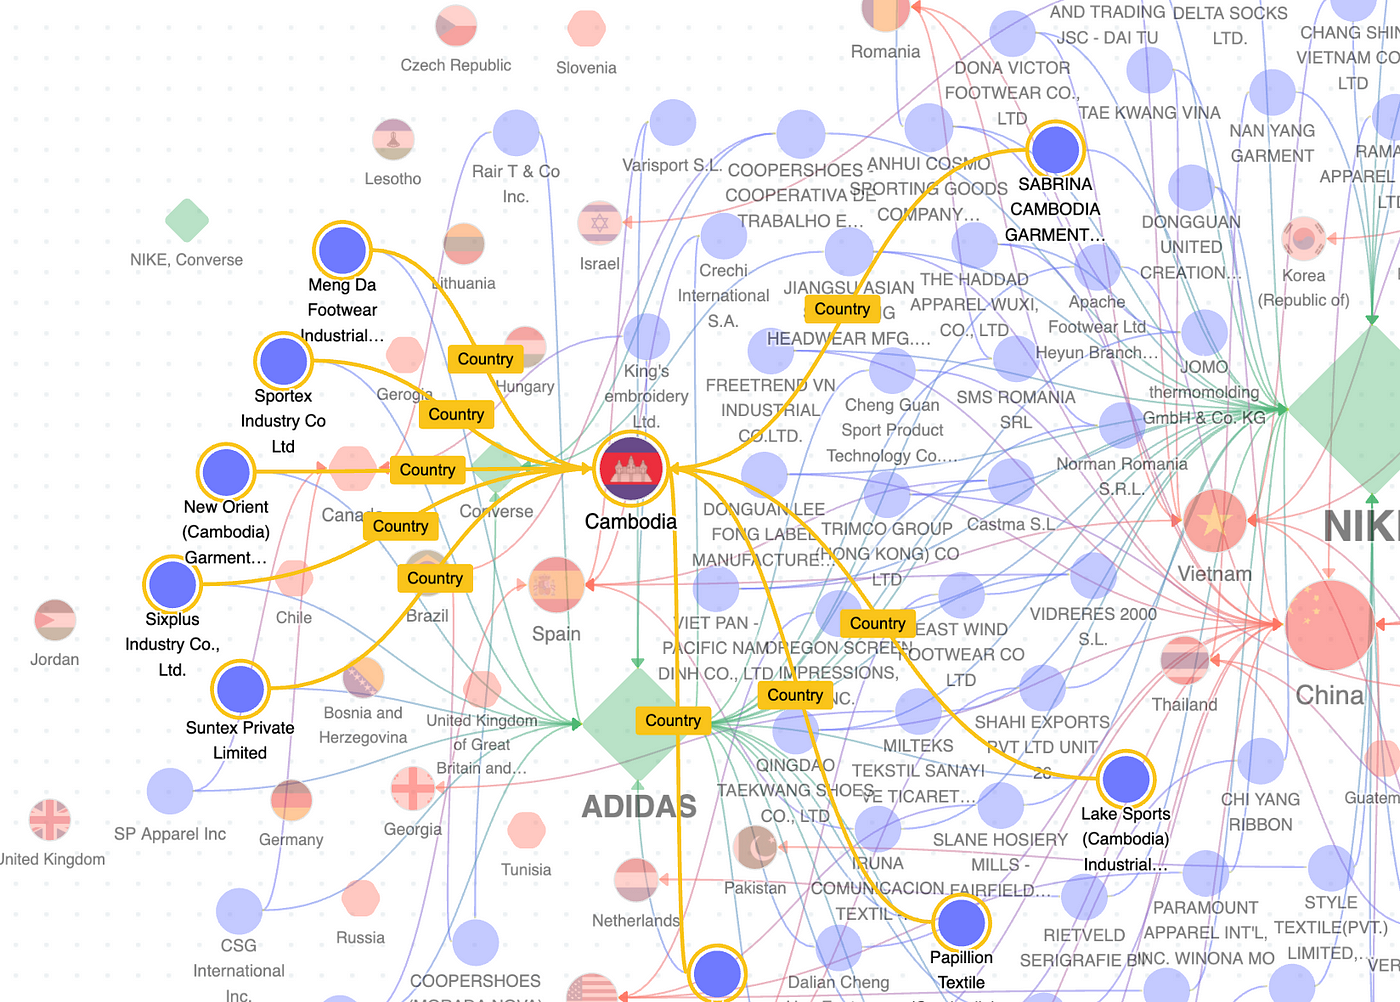
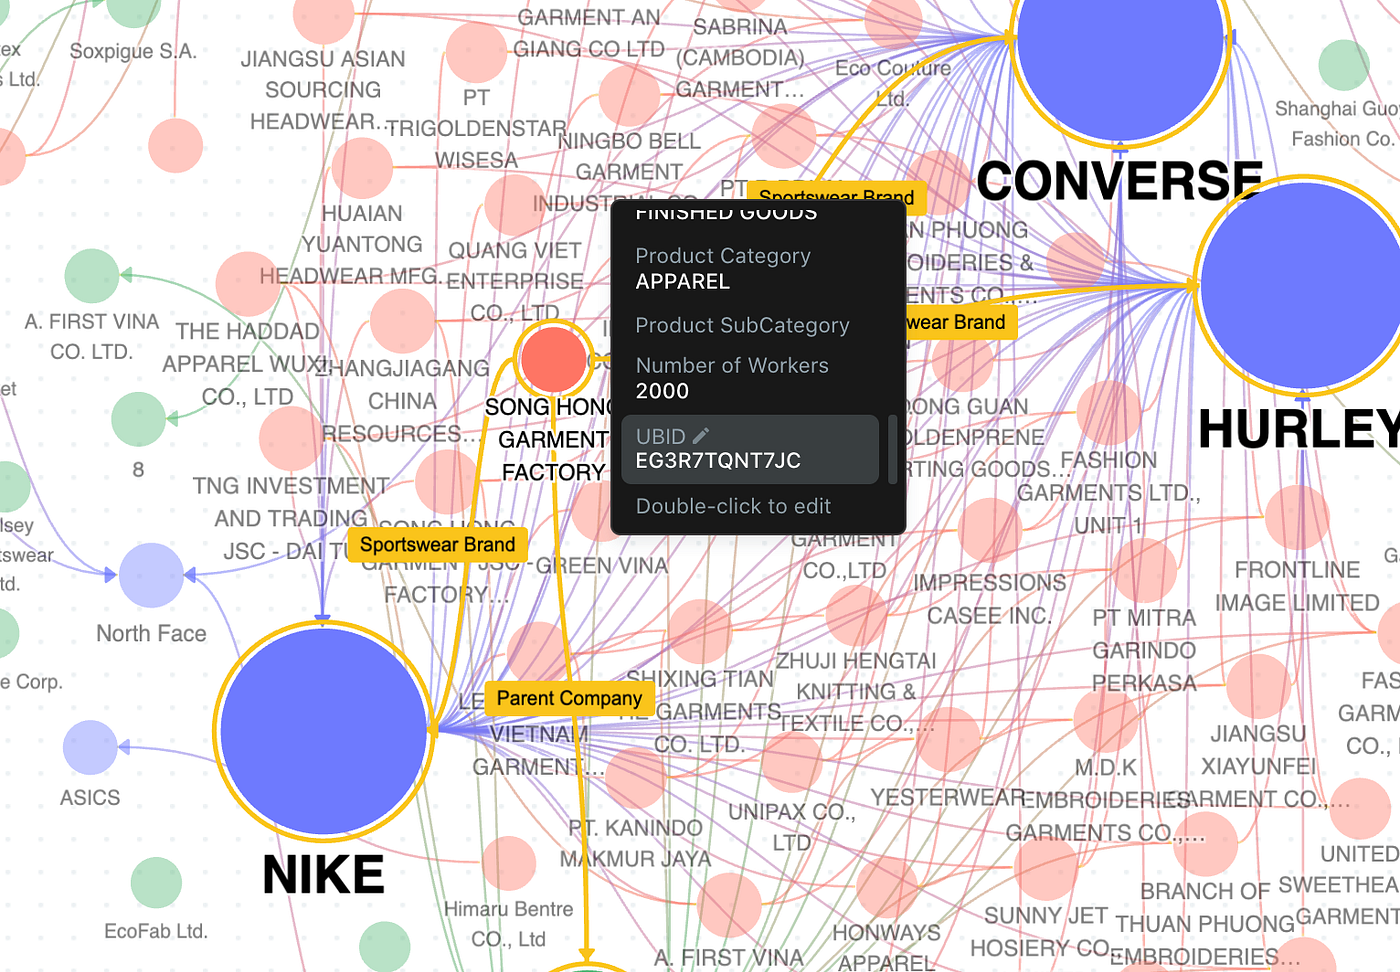
For this project, I was able to create relationships between countries, brands and factories to identify which nations’ actions toward renewable energy solutions can bring the most impact in eliminating environmental risks.
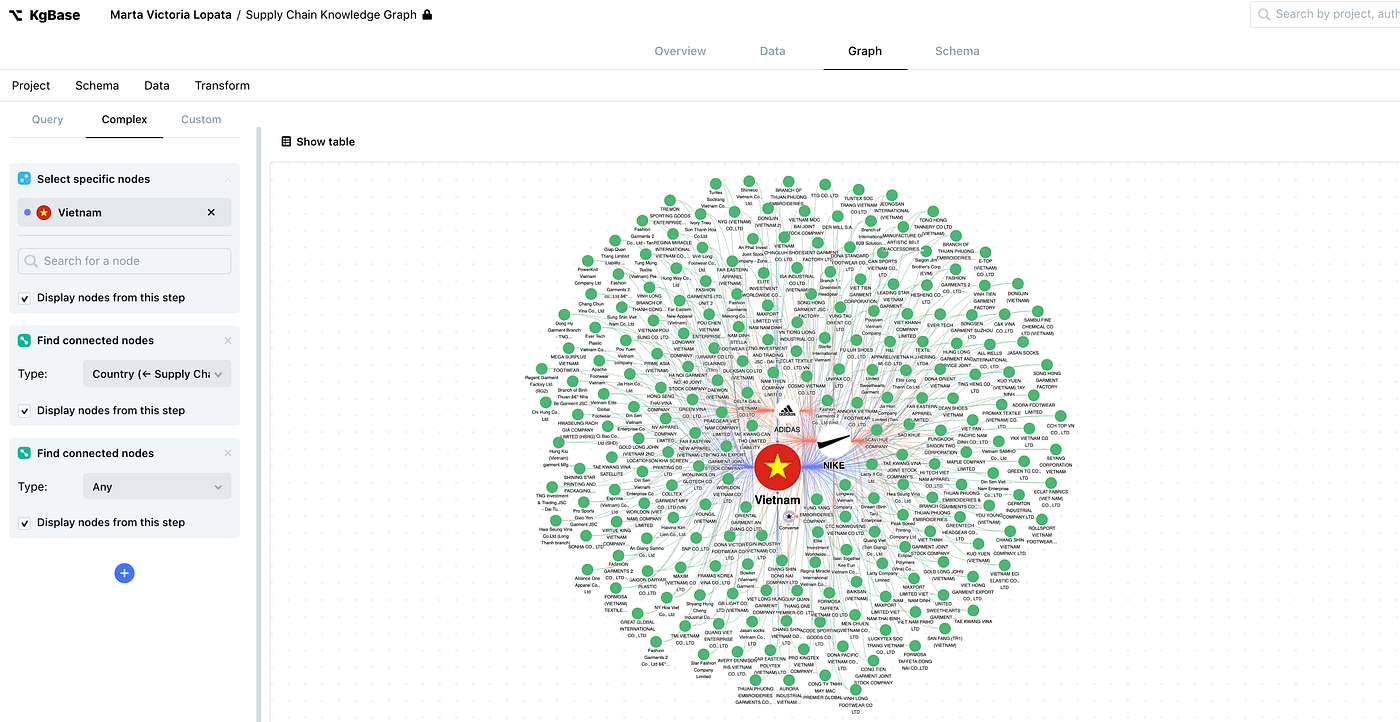
Build Complex Queries to Analyze the Graph
By building complex queries with Kgbase you can answer this and many other questions about supply chain data.
Generate Universal Business Identifiers to Track Vendors across Supply Chains
When analyzing the supply chains of Adidas, Nike and Under Armour, I found that the 3 companies, regardless of different policies and levels of engagement into sustainability efforts and ESG scores, share the same external vendors.
For example: Anhui Sporting Goods Limited
Small private companies like this one are often overlooked in the mapping process.

With Kgbase you can generate Universal Business IDs to track factories across different companies’ supply chains and enrich the data.
UBIDs have many applications across finance, data science and business and can be generated and added to a database of companies here.
About Knowledge Graphs
Knowledge Graphs help build semantic networks that are useful in knowledge representation which helps in establishing relationships between different concepts and how they are visually interconnected.
This interconnectivity helps in gaining new insights from the available data which can lead to new discoveries, different perspectives in analytics tasks and to provide valuable information for predictive pipelines.
KgBase, or Knowledge Graph Base, is a collaborative, robust database with versioning, analytics & visualizations..