A No-Code Approach to Building Knowledge Graphs
by Kenneth Leung, Data Scientist and Licensed Pharmacist
December 3, 2021
Leveraging no-code platforms such as KgBase to gain fresh insights from relational data

The world around us is filled with rich relationships between different entities. We can find meaningful links in our social networks, the organizational charts within businesses, and even across all the publications on Wikipedia.
The data within these connections hold a wealth of information from which deep insights can be drawn, and this is where knowledge graphs excel in capturing these relationships.
This article delves into how we can leverage no-code platforms like KgBase to create knowledge graphs with an example involving drug side effect analysis.
Contents
- Quick Intro to Knowledge Graphs
- Rise of No-Code Platforms
- Creating Our First No-Code Knowledge Graph
- Visualizing The Knowledge Graph
- Enriching Analysis with Business Metadata
- Conclusion
Quick Intro to Knowledge Graphs
A knowledge graph organizes data from a network of real-world entities (e.g., objects, events, concepts) and captures the meaningful (aka semantic) relationships between them.
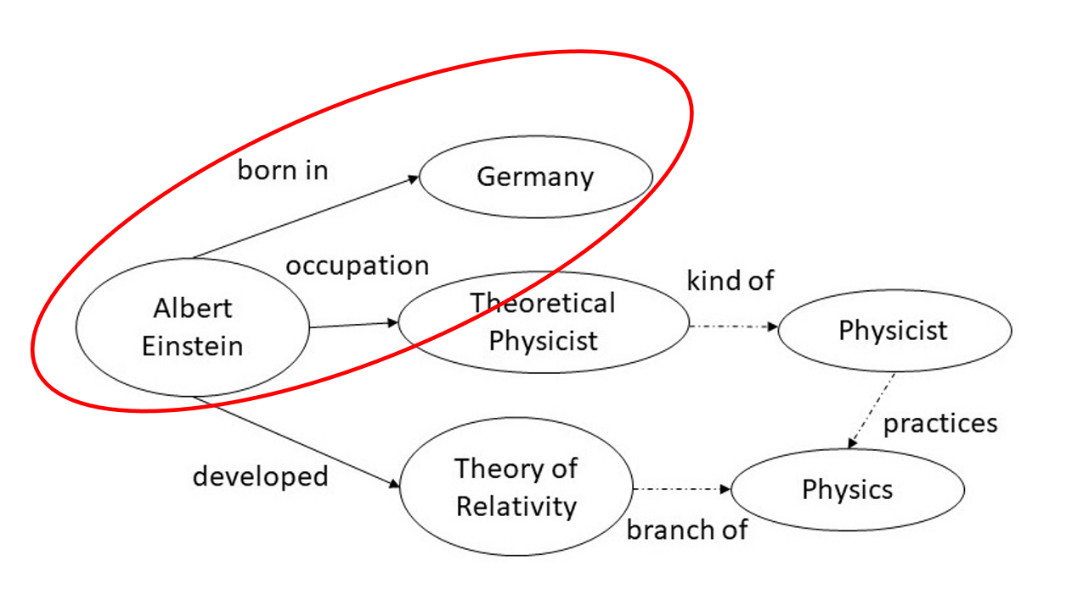
In its simplest form, a knowledge graph is a directed labeled graph that comprises three components: nodes, edges, and labels.
Let’s look at the example (Albert Einstein → Germany) circled in red in the knowledge graph above. The nodes are Albert Einstein (person) and Germany (country), the edge is the connection between the pair of nodes, and the labels represent the meaning of the relationship (i.e., Albert Einstein was born in Germany).
Knowledge graphs have seen a recent popularity boom due to their reliability in representing entities and relations at scale, coupled with increased demand from businesses in extracting value from burgeoning data stores.
They are currently used extensively in many applications across research and industry, such as chatbots, search engines, and product recommendations.

Rise of No-Code Platforms
Despite all the hype over programming, most people do not (and need not) know how to code. What is important is that organizations need to have people who know how to solve problems with the right tools.
The availability of no-code solutions has democratized data science, allowing non-technical users to perform complex analytics tasks without writing any code. These solutions are built around user-friendly user interfaces where users only need to click, drag, and drop elements to execute a range of automated functions.
KgBase is an example of a no-code platform purpose-built for knowledge graphs, providing a plug-and-play system that empowers users to see data in different ways across a wide variety of relationships and entities.
Creating Our First No-Code Knowledge Graph
Let’s explore how we can create graphs with KgBase in just five steps. We will perform an exploratory analysis of the side effects reported from 13 commonly prescribed drugs.
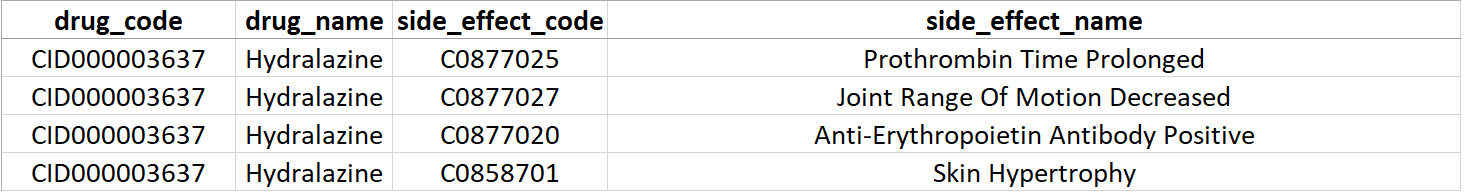
The data is obtained from the Stanford Network Analysis Project (SNAP). Specifically, we have three smaller datasets (from the original ChChSe-Decagon dataset) to work with:
- DRUGS.csv → Drug name and PubChem code of the set of 13 drugs
- SIDE-EFFECT.csv → Side effect name and corresponding code (MedGen Concept ID)MATCH-DRUG-SIDE-EFFECT.csv → Tabular data of drugs and corresponding side effects
Feel free to download these three datasets here.
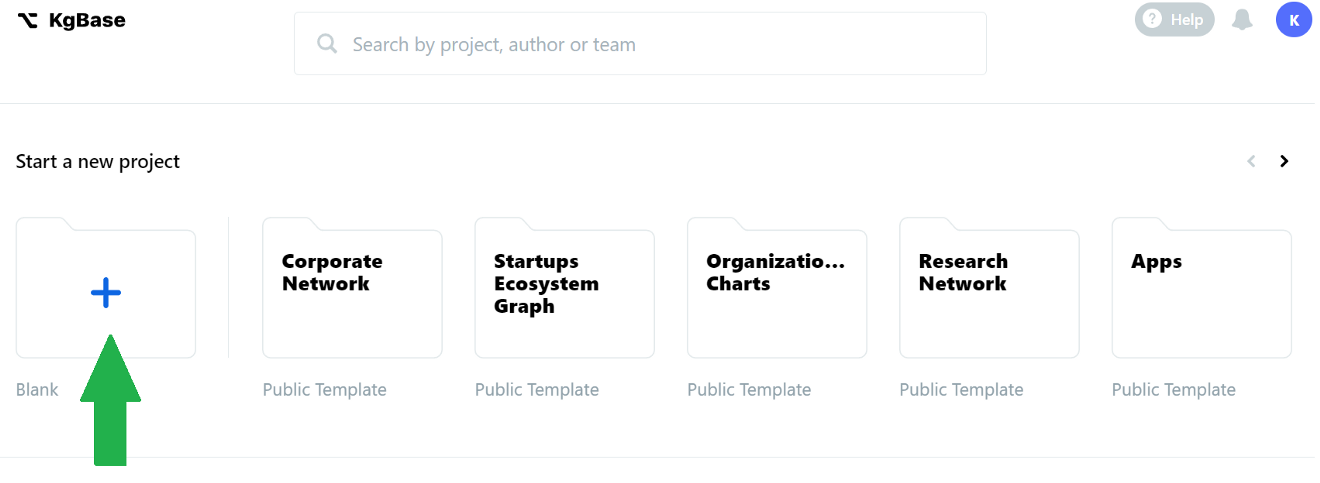
Step 1 - Create Project
Upon logging in, we will see the Dashboard landing page. Click on the blank folder (with the +) to start a new project with a blank template, and give the project a name e.g., Drug-Side-Effects.
Step 2 - Importing Data
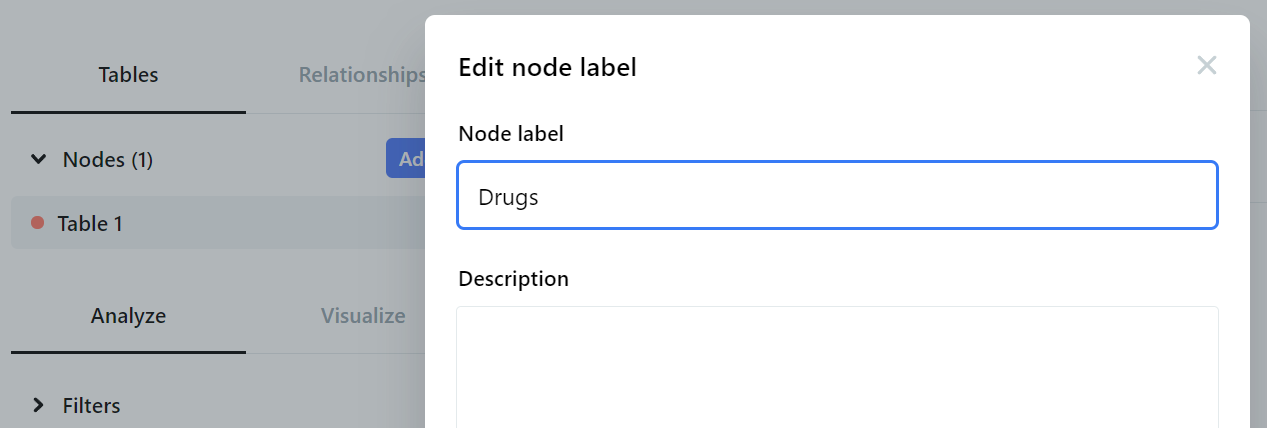
After project creation, there will already be a default node titled Table 1. The aim now is to create a node for each of the three datasets.
We first rename the default node to Drugs by clicking on the ellipsis (•••) menu beside Table 1 and select Edit to change the Node label.
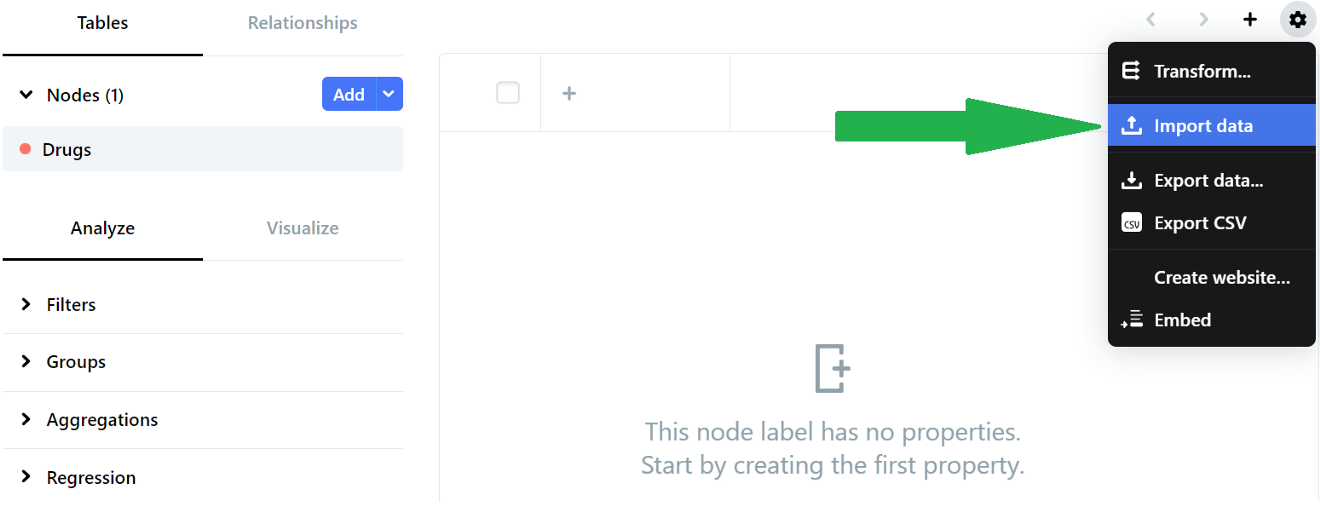
From here, we can import the data. In the Data tab, click on the gear icon and select Import data from the menu.
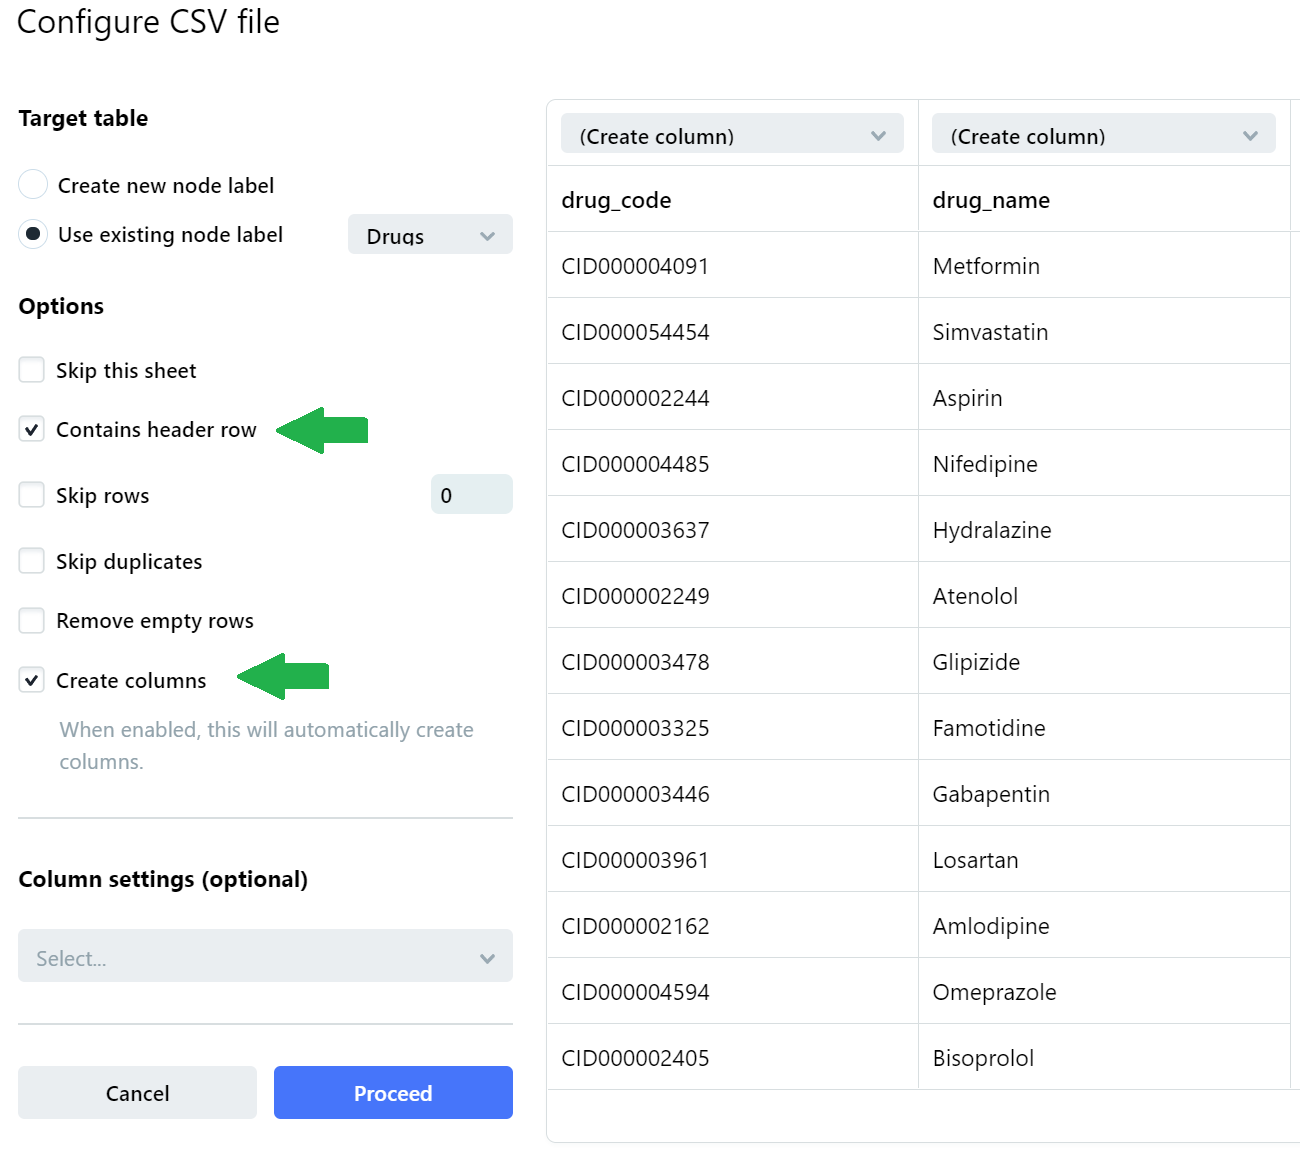
Locate the DRUGS.csv file for upload, and check the two checkboxes of ‘Contains header row’ and ‘Create columns’ on the subsequent Configure CSV file section before clicking Proceed.
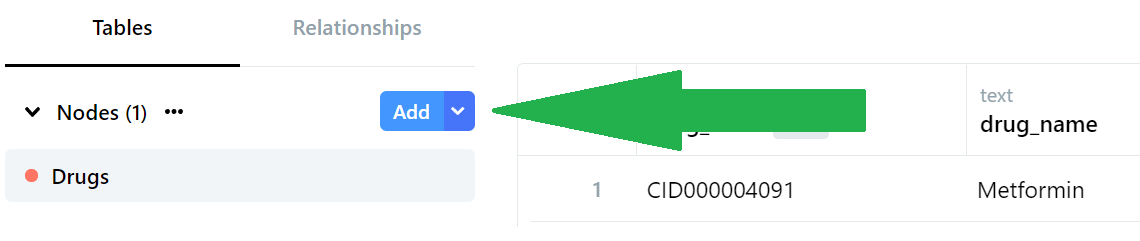
With that, we are done with our first node containing the DRUGS.csv data. We then add two more nodes and repeat the above instructions for the remaining two datasets. We add nodes by clicking the Add button, and we name these next two nodes as Side Effects and Matching Table.
After this is done, we should have three nodes: Drugs, Side Effects, and Matching Table.
Step 3 - Setting Labels
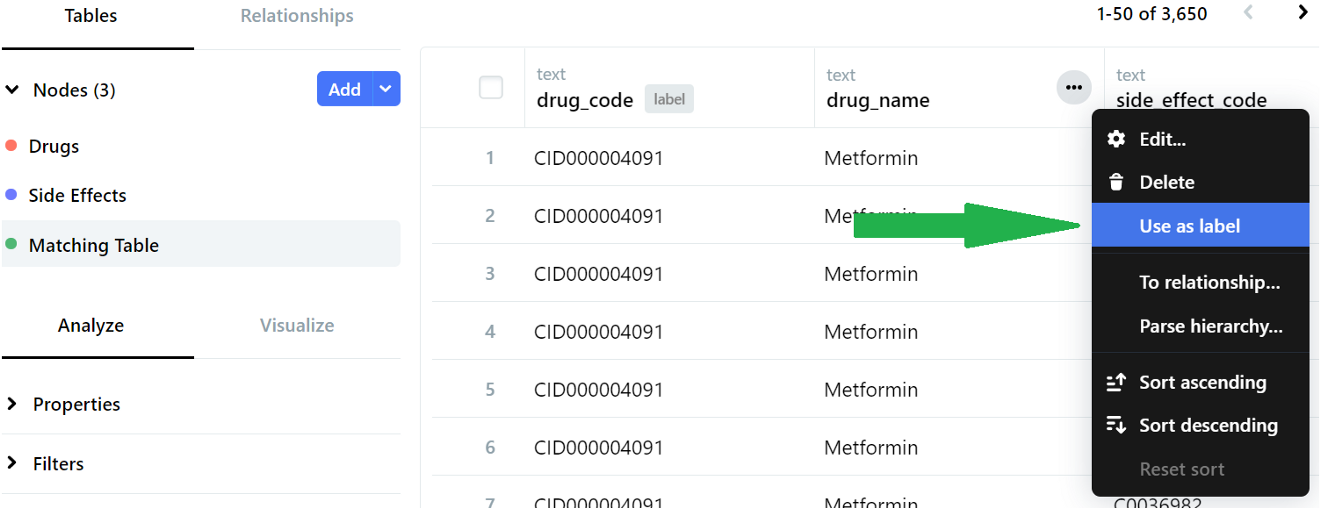
We set labels as the names of the drugs and side effects so that our graphs will display names instead of incomprehensible codes.
We first select ‘Use as label’ from the ellipsis dropdown menu beside the column header. Make sure that this is done for all three nodes so that the columns of drug_name and side_effect_name will ultimately have a grey-colored ‘label’ indicator beside them.
Step 4 - Defining relationships between nodes
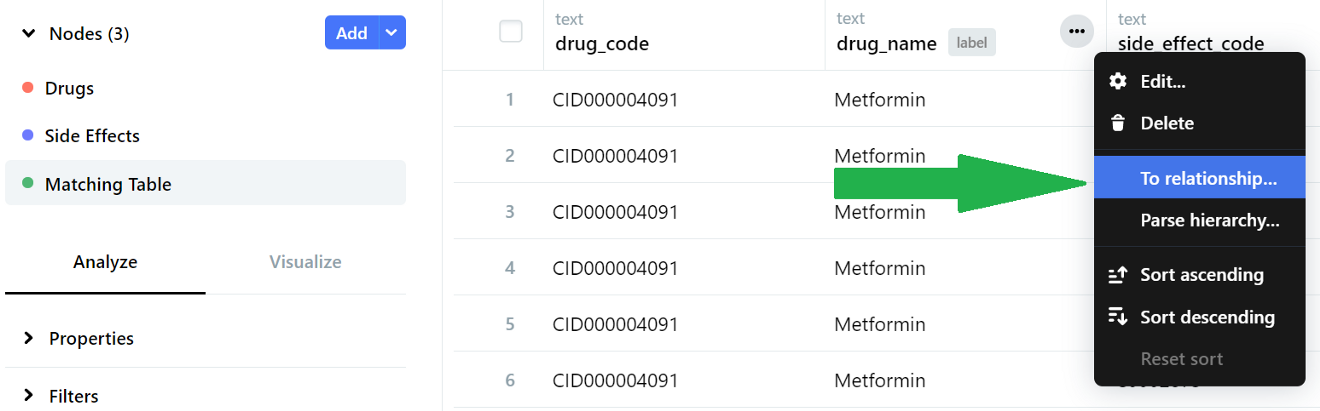
Head over to the ‘Matching Table’ node to define relationships between all our nodes. We click on the ellipsis menu beside the drug_name header and select ‘To relationship’.
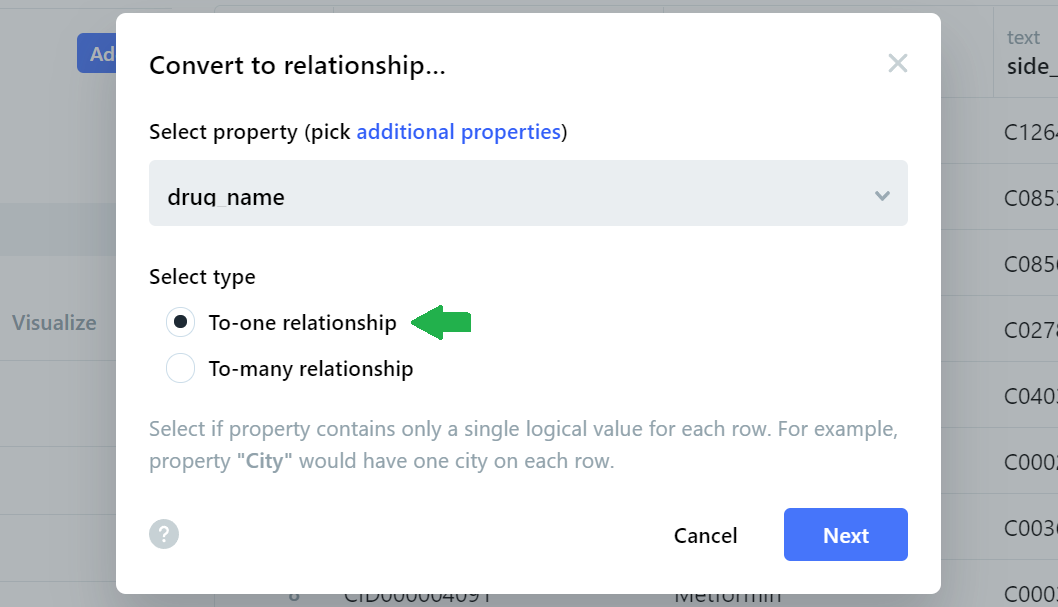
We choose the ‘To-one relationship’ button (since this is a one-to-one name mapping) and then click Next.
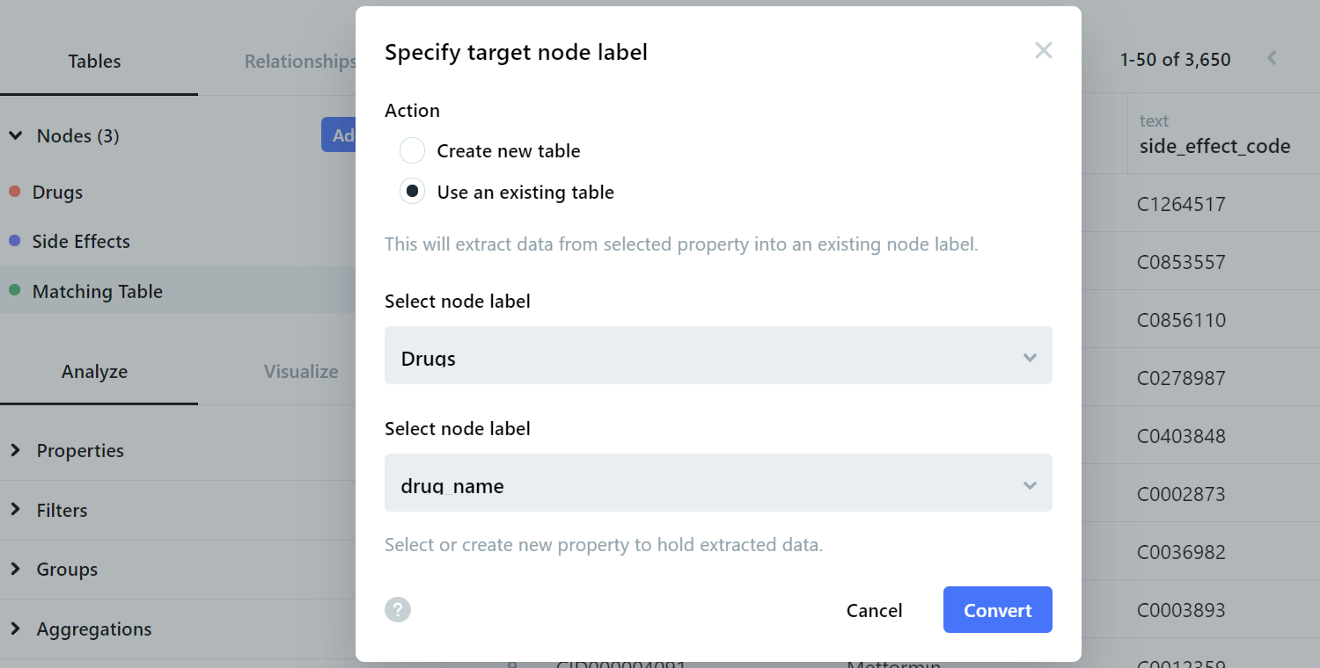
On the next page, we will be asked to specify a target node label. Our target node label (drug_name) already exists in the Drugs node, so we select the appropriate labels from the existing table before clicking Convert.
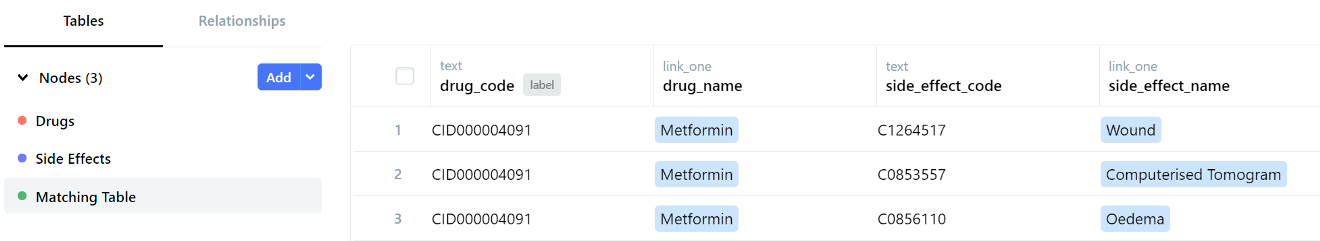
We repeat this step for the side effects, where we create a To-one relationship for side_effect_name in the Matching Table node with the matching side_effect_name in the Side Effects node.
When this step is completed successfully, we will see that the labels are highlighted in light blue in the Matching Table.
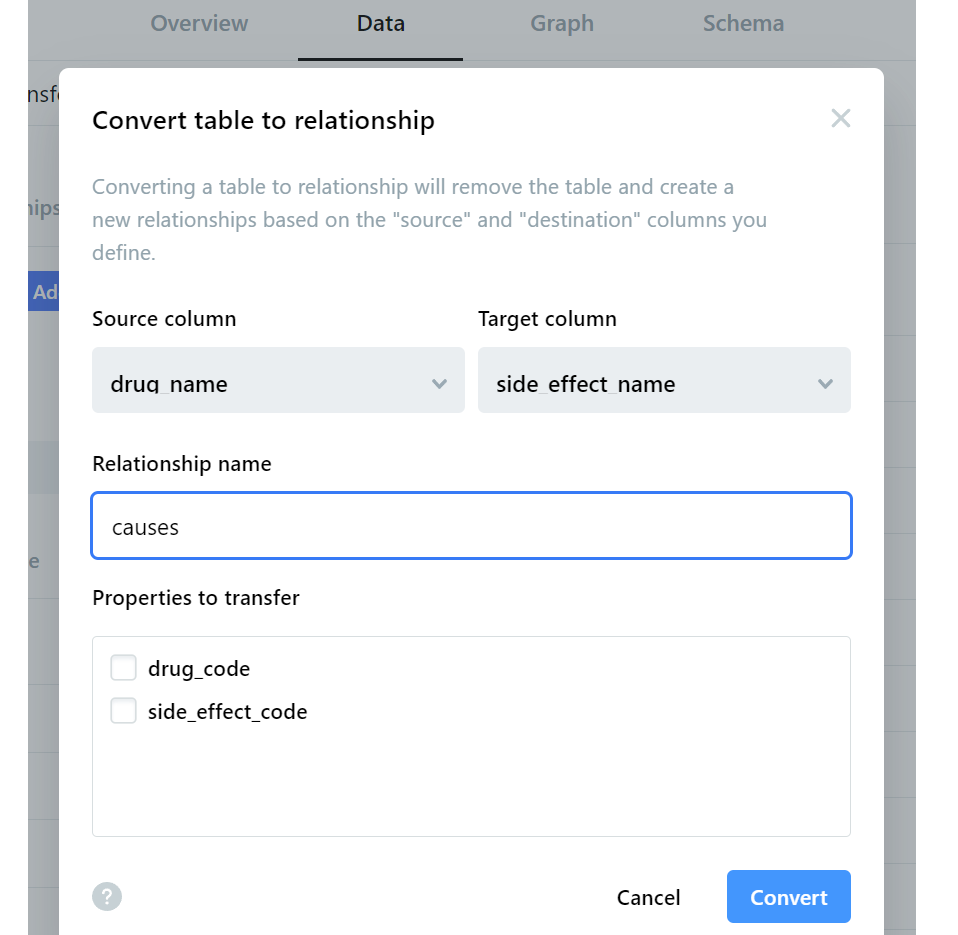
Step 5- Convert Table to Relationship
The final step is to convert the entire matching table into relationships based on source and target columns. The source is drug_name, and the target is side_effect_name since we want to link each drug to its side effects.
We perform this conversion by clicking the ellipsis menu for the Matching Table node and selecting ‘To relationship’.
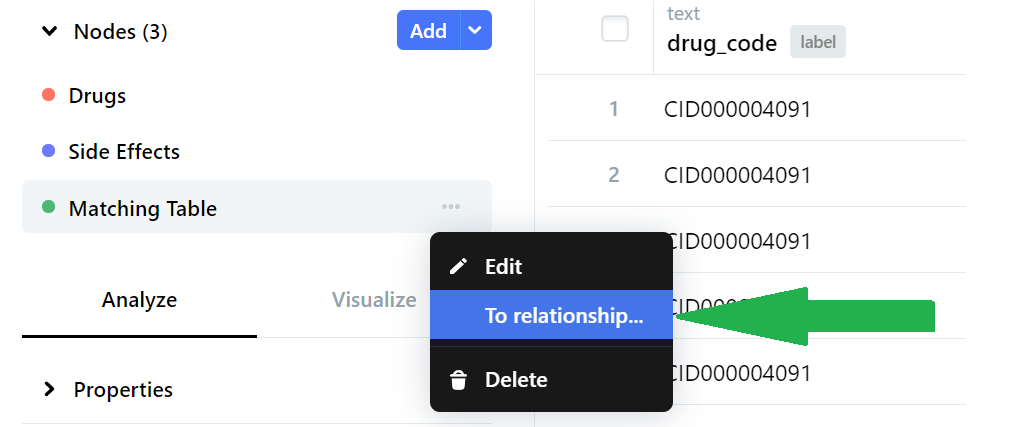
On the next page, we define the corresponding source and target columns and then select Convert.
Upon conversion (which takes 5 to 10 minutes), we would have completed our knowledge graph without writing any code!
Visualizing The Knowledge Graph
Let’s take a look at the visualization of the knowledge graph we built. We do this by clicking the Graph tab at the top bar, where the page will then display the graph diagram (based on a random sample of the entire network).
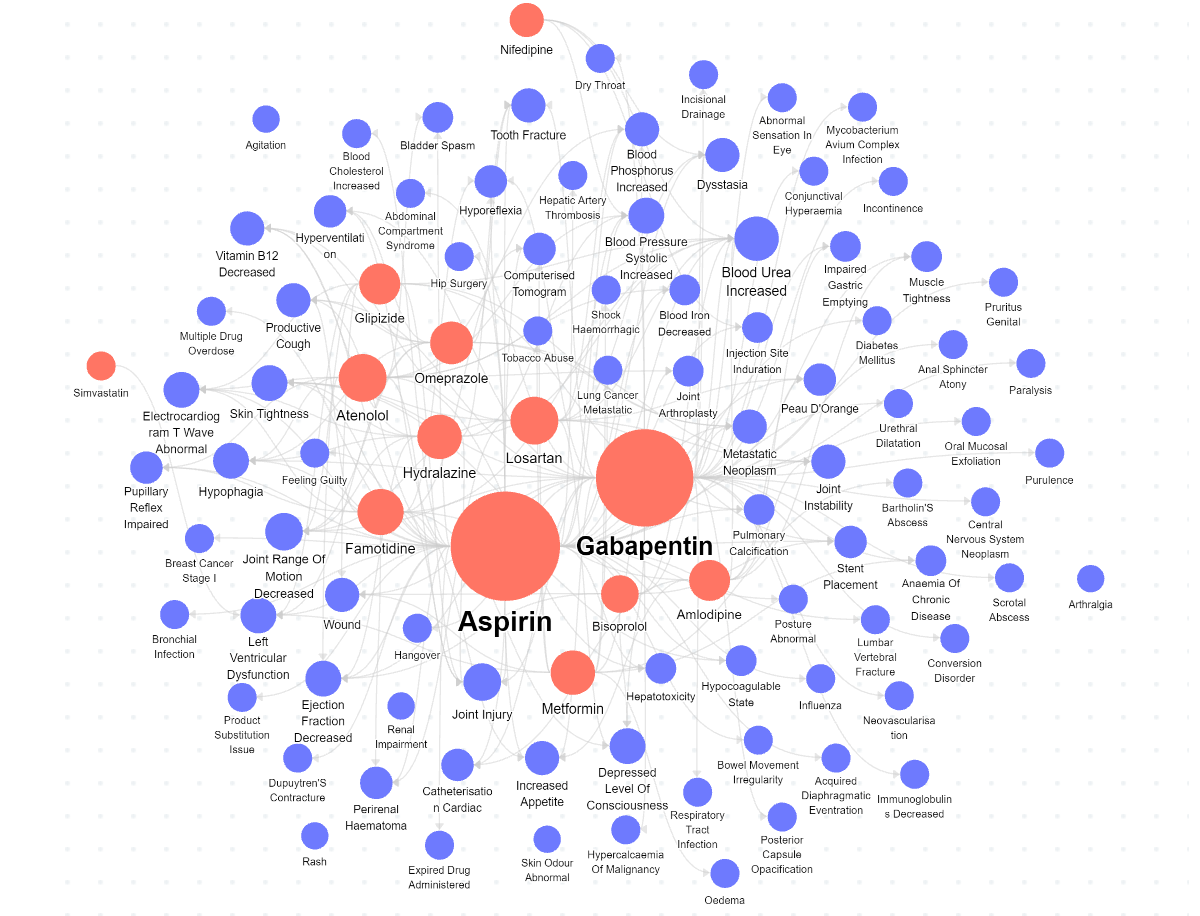
The red nodes represent the drugs, while the blue nodes represent the side effects. We can easily see that Aspirin has the highest number of side effects based on node size.
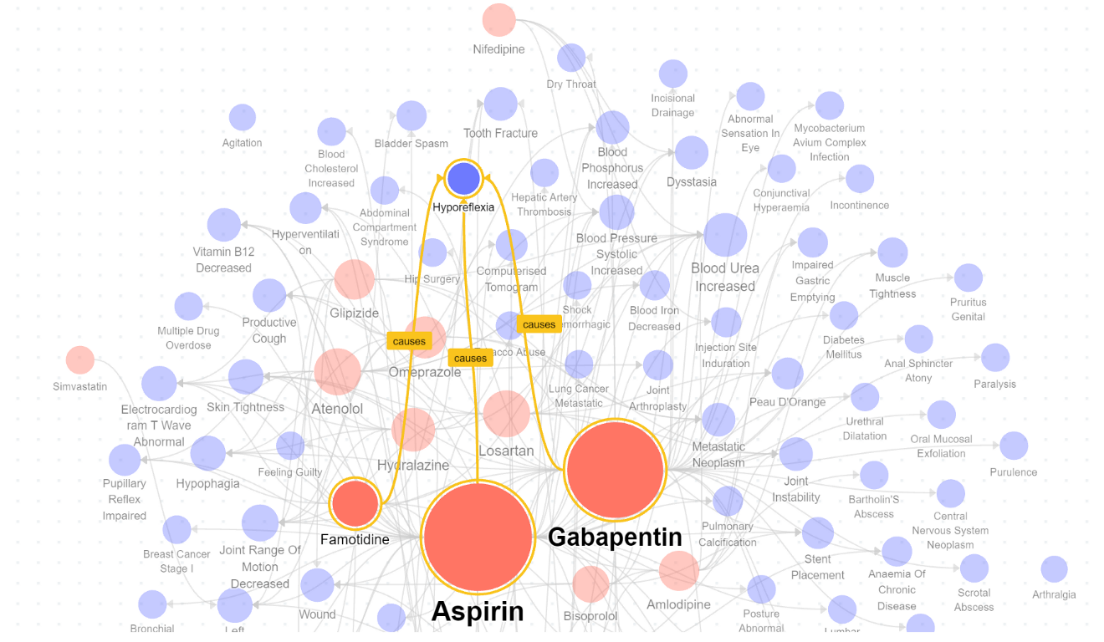
When we select a single side effect, e.g., hyporeflexia, we can see which drugs can potentially cause that specific side effect.
There is also a wide range of options available in the user interface for deeper analysis. These options include filters to limit the graph to specific properties and complex queries to locate paths based on pre-defined constraints.
You can explore the public folder for this project over here.
Enriching Analysis with Business Metadata
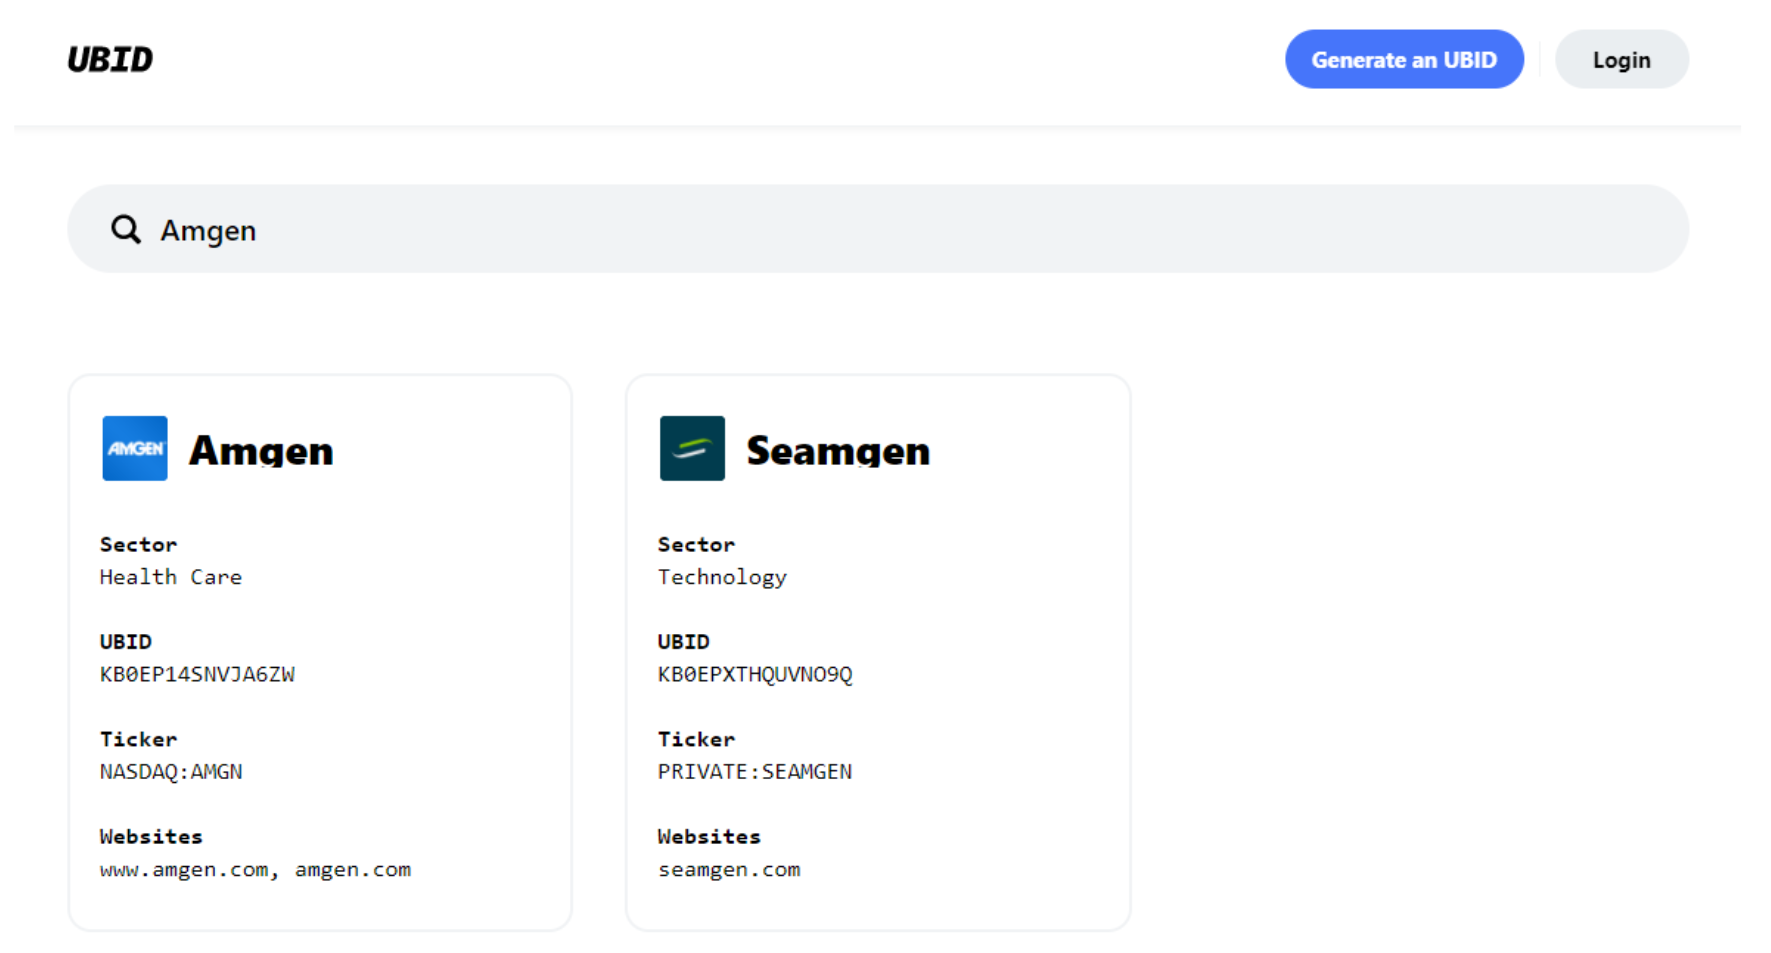
Beyond creating knowledge graphs, KgBase is also home to an open-collaboration knowledge graph base containing business metadata for more than 100,000 companies worldwide. This rich database empowers users to tie together disparate and fragmented data symbologies and eliminate redundant mapping processes.
For example, a simple search of the pharmaceutical company ‘Amgen’ returns its Universal Business Identifier (UBID) and corresponding metadata such as brand mapping and financial identifiers (e.g., CUSIPs, ISINs, DUNS, FIGI numbers, etc.)
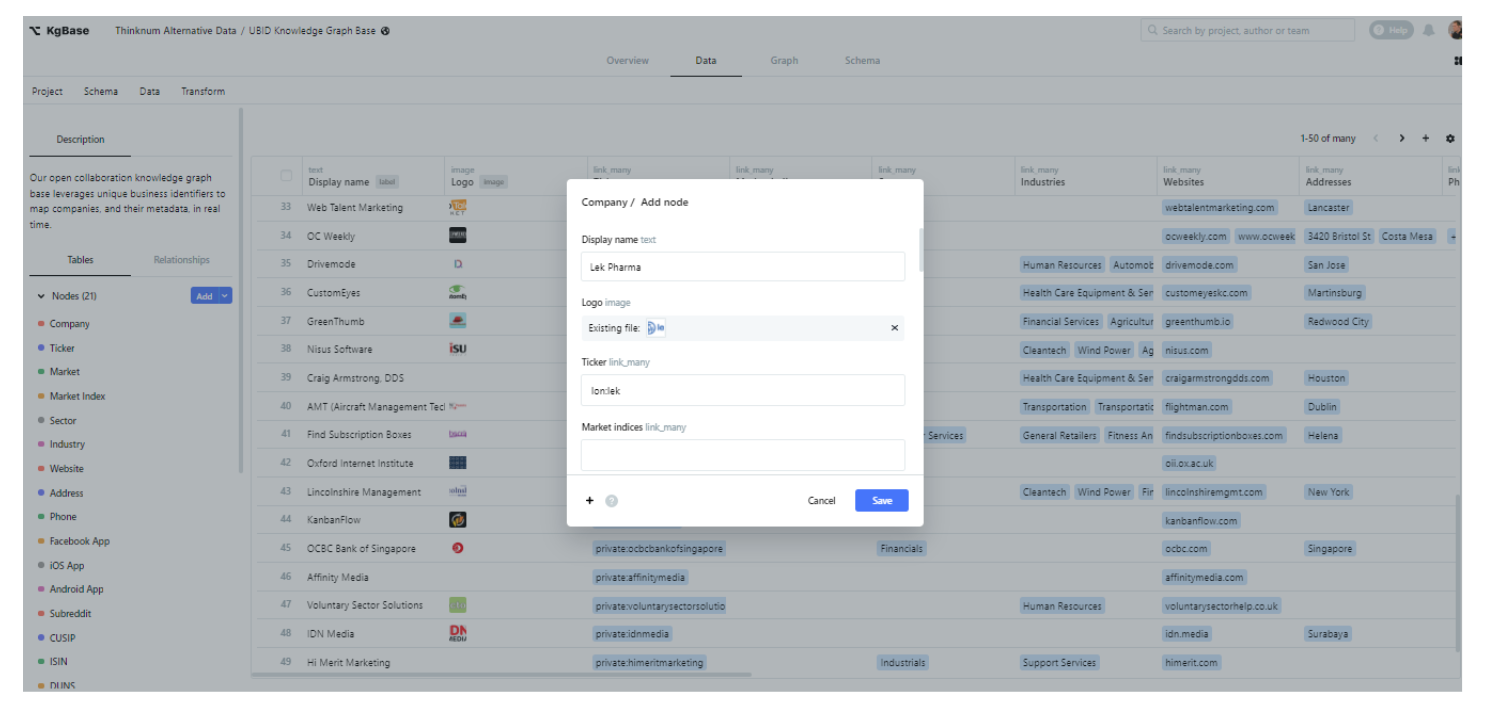
In the spirit of open-source collaboration, users can enrich this database by contributing business metadata that does not yet exist.
For example, the UBID for “Lek Pharma” was provided by a contributor, and this information was subsequently approved and added.
Conclusion
We have seen only the tip of the iceberg regarding the capabilities of knowledge graphs. For example, enterprises can also create universal data sources using knowledge graphs to connect multiple data sources across different domains.
Building knowledge graphs required a lot of effort in the past, but no-code platforms like KgBase have made it much easier for non-experts to create, integrate and maintain such systems.
It would thus be no surprise to see these platforms continue to grow increasingly mainstream and help democratize the benefits of using knowledge graphs.